A/B TESTING? MORE LIKE A/BEER TESTING: AN AMOOBI CASE STUDY
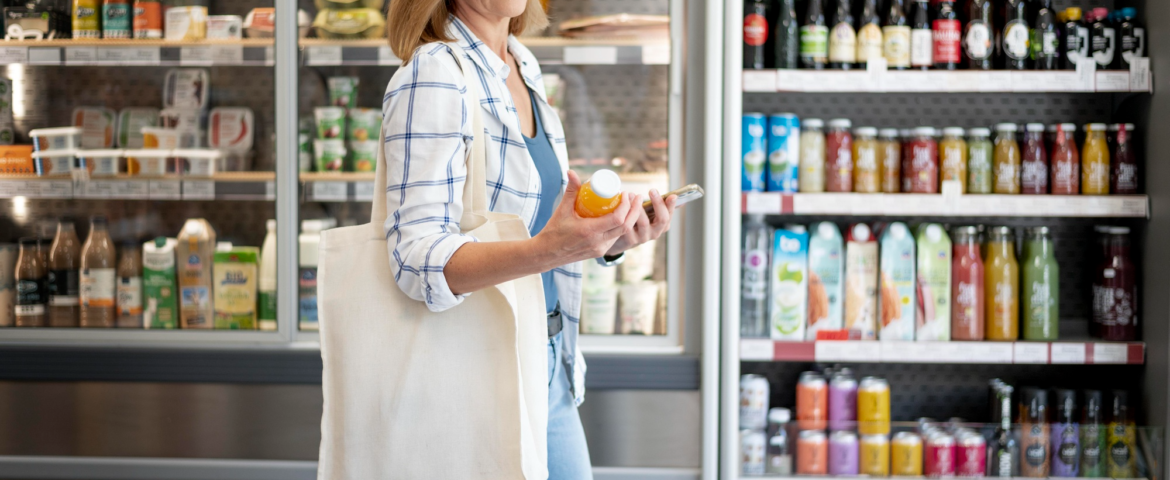
When I was a Buyer for Walmart’s ecommerce division, one of the most important parts of my job was running A/B tests: a form of two-sample hypothesis testing where you take one thing, try it out, and then do another, similar thing. This way, you can compare two actions and see which gleans better results. For web merchandising, this usually took the form of something like adjusting the product appearance order on browse pages, or altering the format of imagery. The goal was to see if some change sparked a substantial increase in product views or conversion.
In brick and mortar, A/B testing happens too: what happens if we move this product to the end of the aisle? What if we put this SKU on an endcap instead of an in-line shelf?
But when you A/B test in brick and mortar, you can’t truly solve the puzzle; your answers are limited. Though you can measure changes in product sales or basket size, you have no idea how it impacts customer movement. Those data points are usually built off assumptions – at least they are if you don’t work with Amoobi.
A Case Study: How can Amoobi help you understand how your customers are acting in store?
Amoobi takes the guesswork out of understanding how customers are acting on the floor of brick-and-mortar stores. Take the following case study: Amoobi worked with a retail client that was trying to improve their beer category. The client wanted to determine which of their shelves had the most traffic and the most engagement, and which shelves were struggling to retain customers. Using that information, they intended to do a MOD reset that drove traffic to shelves with high engagement and eliminate shelves that were lost causes.
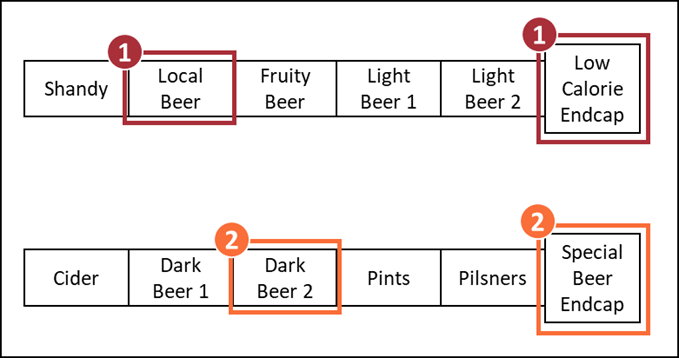
The below is a mockup of the retailer’s initial beer planogram. Each box represents a different shelf. In instances where different product types are spread out across multiple shelves, each different shelf name is based on its numerical order (e.g. “Dark Beer 1,” “Dark Beer2”):
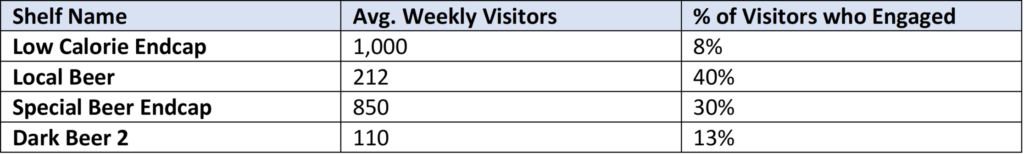
Upon looking at the initial data, we saw a few key areas of opportunity. Firstly, the endcap featuring Low Calorie Beers experienced high footfall, but did not have a lot of engagement. However, at the other end of the aisle, there were products experiencing the opposite problem. Local Beers was able to get a large percentage of its customers to engage, but footfall was not particularly high.
Second, we found that the Special Beer Endcap was doing very well. It had a substantial amount of traffic because it was on the edge of the aisle; however, the real advantage was its engagement. 30% of customers who visited the endcap stopped at it, showing it’s an incredible force across all metrics. It had even more engagement than an in-aisle shelf, Dark Beer 2.
What did we do with this information?
Amoobi recognized the client had a core problem: they wanted to grow traffic to Local Beers, as it had a lot of engagement but a low visit count. They also wanted to use the success of the Special Beer Endcap to improve shelves in-aisle. Amoobi recommended switching around the shelves in order to optimize space performance. The core recommendations revolved around putting shelves with high engagement in areas where they would experience more traffic. After the switches, the modular looked like this:
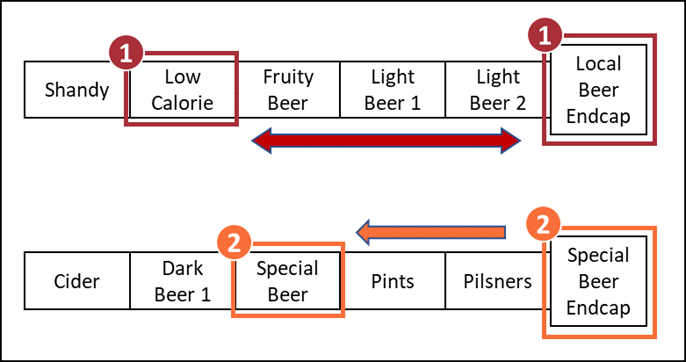
Local Beer was put on an endcap so it would receive more traffic and take advantage of its high engagement rate. Low Calorie Beer was moved deeper in because it was not as much of a priority.
Special Beer kept its spot on the endcap, but was also given a shelf deeper in the aisle, as the shelf it replaced, Dark Beer 2, was dramatically underperforming. This is the pre-post:
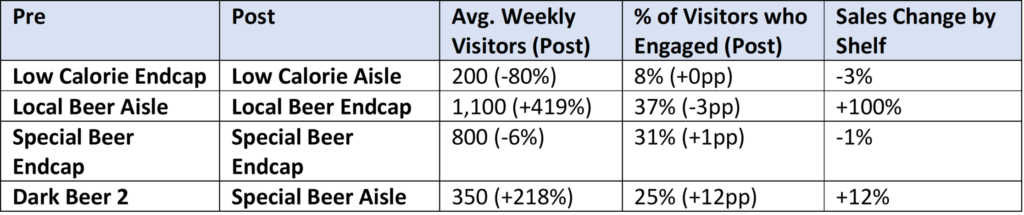
Overall, it was a positive experiment. All shelves at the very least maintained their previous levels of engagement, and the only shelf that experienced a substantial decrease in traffic was Low Calorie Beer. It only lost traffic because it was moved away from the main aisle of the store.
The biggest wins, however, can be found in the newly made Local Beer Endcap and Special Beer Aisle Shelf. The original Local Beer shelf in the aisle had high engagement, but its visitors were lacking. To solve this, Amoobi recommended the retailer shift its Low Calorie SKUs to in the aisle, and give endcap space to local beers. It worked wonders: Local Beer maintained the same level of engagement (between 35 – 40% at any given time) but traffic to the shelf increased by over 400%, meaning conversion and overall sales went up substantially as well.
Special Beers experienced similar success. The endcap’s products were also given a spot in the aisle, replacing an underperforming shelf. While the endcap’s performance did not change despite an alternate point of sale, the new in-aisle special beer shelf worked wonders. The shelf’s engagement increased by +12pp, and traffic increased by over 200%.
These solutions were only implemented and tested because Amoobi was able to track issues with traffic, all through the use of data. Though we can never replicate ecommerce tools perfectly in brick-and-mortar environments, traffic monitoring technology is the first step in getting as close to that level of detail as possible. Retailers’ abilities to test inside their stores will improve tenfold, and allow them the opportunity to never make assumptions about an A/B test again. After all, why make assumptions when you can just know the answer upfront?
Are you interested in running your own A/B tests to alter customer behavior? Reach out to info@amoobi.com today to see how we can help you make the most out of your shelf space.